NASA Earth science data are vital components of investigations into biological diversity, species distribution, and ecological conservation.
![]()
An ecological data revolution is underway. Ecologists have gained unprecedented insights into Earth’s many biological systems, from determining populations of species to tracking and observing interactions between ecological communities to using DNA from the environment (eDNA) to identify invasive or rare species. This revolution is driven by the integration and harmonization of multiple data sources at multiple spatial scales.
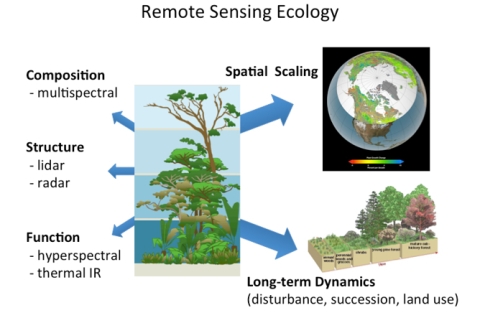
Traditional field observations provide data on organisms and their environment at the local level. NASA satellite-based remote sensing data complement field data with environmental variables, such as temperature and precipitation, and vegetation data, such as canopy height and evapotranspiration.
The Biological Diversity and Ecological Forecasting Data Pathfinder is divided into four parts, each of which contains data that provide information to assess Essential Biodiversity Variables and Sustainable Development Goals. Click on the links below to find data specific to the section:
New to using NASA Earth science data? This pathfinder is designed to help guide you through the process of selecting and using applicable datasets, with guidance on resolutions and direct links to the data sources. After getting started here, there are numerous NASA resources that can help develop your skills further. If you are new to remote sensing, check out What is Remote Sensing? or view NASA's Applied Remote Sensing Training on Fundamentals of Remote Sensing.
Please visit the Earthdata Forum, where you can interact with other users and NASA subject matter experts on a variety of Earth science research and applications topics.
About the DataNASA collaborates with other federal entities and international space organizations, including NOAA, USGS, the Japan Aerospace Exploration Agency (JAXA) and Ministry of Economy, Trade, and Industry (METI), and the European Space Agency (ESA), to provide data used in understanding a number of biological phenomena, including vegetation characteristics and change, biodiversity, the impacts of human activities on the natural environment, and habitat suitability. Some of these phenomena can be detected directly through remote Earth observation. For instance, forest loss can be tracked by comparing satellite imagery across time, and the distribution of ecosystems and species can directly be detected by the color signatures that characterize them. Species-specific detection is challenging with multispectral data due to the coarse spatial resolution; however, with hyperspectral data (having a high spectral resolution), the unique spectral fingerprint each species has can provide species-specific information for vegetation mapping and individual species identification.
Other biological phenomena are detected indirectly through models, which often use remotely sensed and ground-based observations of environmental variables as inputs. For example, species distribution or movement can be modeled by comparing known occurrence locations or movement records to the surrounding physical characteristics of the landscape. These analyses can help forecast where species are likely to be distributed in the future.
NASA’s Earth science data products are validated, meaning their accuracy has been assessed and verified over a widely distributed set of locations and time periods via several ground-truth and validation efforts. These data are freely and openly available to all users.
Datasets referenced in this pathfinder are from sensors shown in the table below. Some of these datasets are available through NASA's Land, Atmosphere Near real-time Capability for Earth Observations (LANCE). LANCE provides data to the public within three hours of satellite overpass, which allows for near real-time (NRT) monitoring and decision making. If latency is not a primary concern, users are encouraged to use the standard science products, which are created using the best available ancillary, calibration, and ephemeris information.
In addition to mission data, NASA has a series of models that use satellite- and ground-based observational data to produce high-quality fields of land surface states and fluxes. The Modern-Era Retrospective analysis for Research and Applications version 2 (MERRA-2) is a NASA atmospheric reanalysis that uses Goddard Earth Observing System Model, Version 5 (GEOS-5) with its Atmospheric Data Assimilation System (ADAS). The MERRA project focuses on historical climate analyses for a broad range of weather and climate time scales and places the NASA suite of observations in a climate context.
Use the Data
Scientists, researchers, land managers, decision makers, and others use remote sensing data in numerous ways. Satellite imagery, coupled with ground-based data, aids in our understanding of species distribution, biodiversity, ecosystem services, conservation, and much more. NASA Earth science observations are transforming our approach to some of these critical issues. For examples of how people have used the data, visit the Land Processes Distributed Active Archive Center (LP DAAC) Data in Action, or read our Biodiversity Feature Articles, which includes related Data User Profiles.
Ecosystems respond to changes in land use and climate with changes in species abundance and distribution, as well as altered ecosystem services, such as nutrient recycling and water storage. Understanding potential changes and how they might impact ecosystems provides the ability to detect the negative and often detrimental effects of drought, invasive species, reduced biodiversity, fire susceptibility, disease vectors, and other changes. Increasing knowledge of how ecosystems change under current conditions also helps us to model ecosystem and habitat changes under different climate scenarios.
“Conservation biologists rely on estimates of species richness (i.e., the number of species in a particular place) as they race to determine areas in which to spend limited resources in an age of rapid biodiversity decline. Scientifically sound environmental management requires frequent and spatially detailed assessments of species numbers and distributions. Such information can be prohibitively expensive to collect directly. Measuring the distribution and status of biodiversity remotely, with airborne or satellite sensors, would seem an ideal way to gather these crucial data” (Turner, et al, 2003).
Many ecological questions are answered using remote sensing and ground-based data. NASA-funded projects within each of the four sections of this data pathfinder provide more details on how NASA data are contributing to ecological research.
Researchers have used very high resolution satellite imagery to directly detect animal populations:
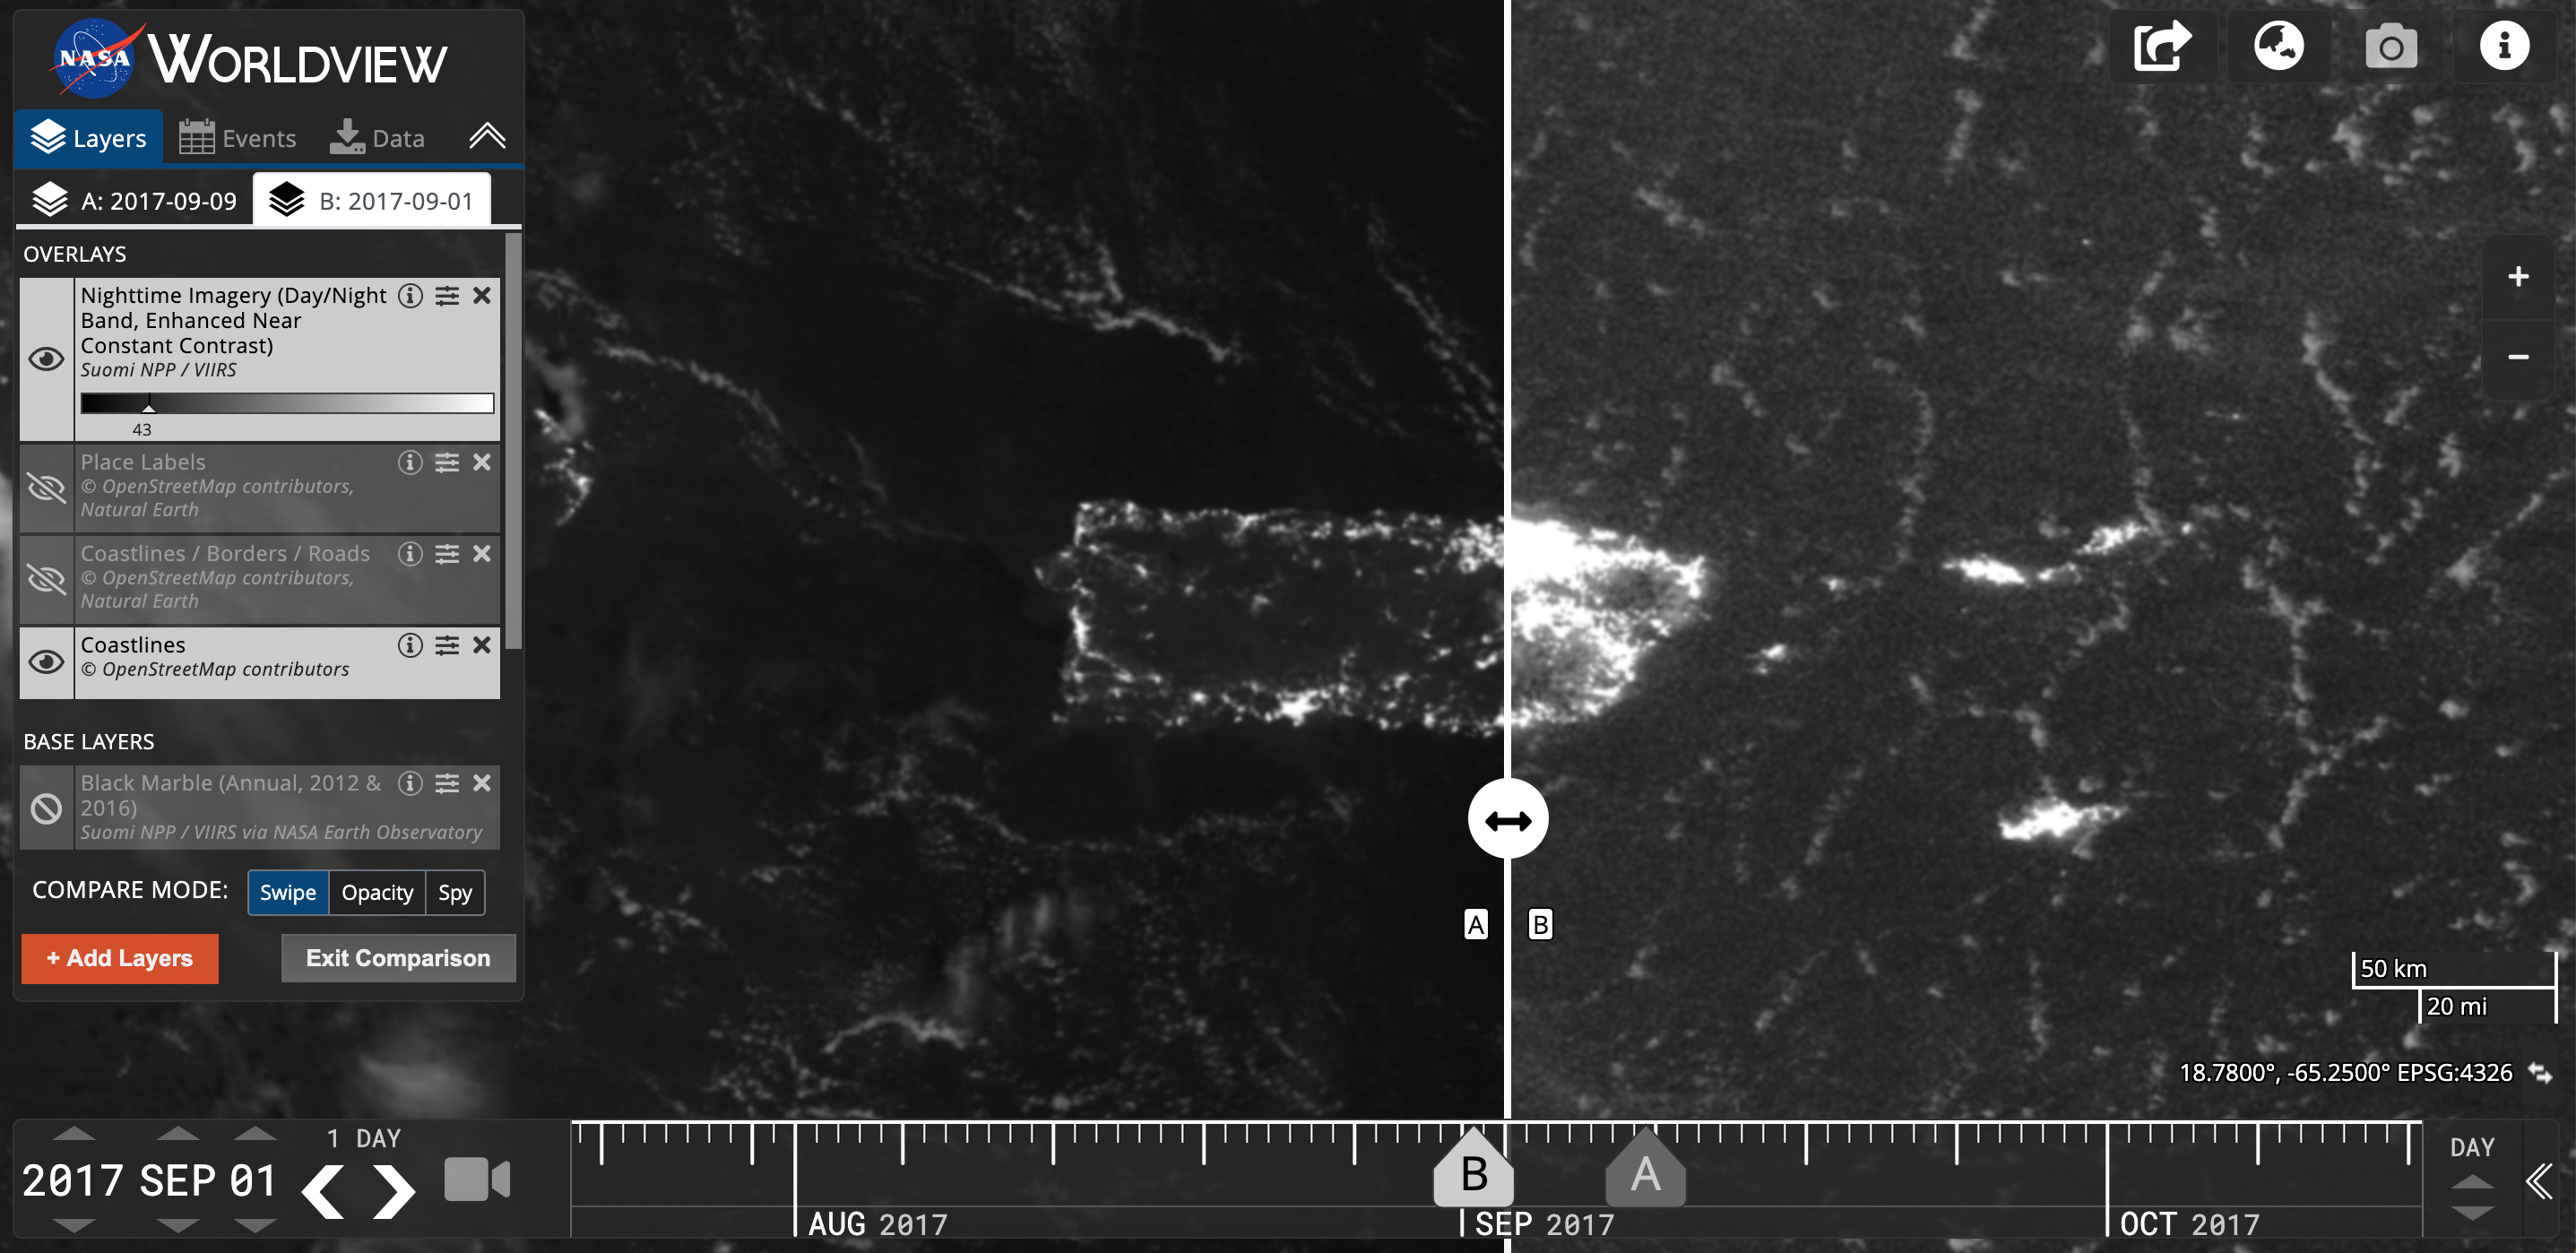
Researchers are using the joint NASA/NOAA Suomi National Polar-orbiting Partnership (Suomi NPP) satellite's Visible Infrared Imaging Radiometer Suite (VIIRS) day/night band to detect biological activities or changes in behavior due to artificial light around urban environments.
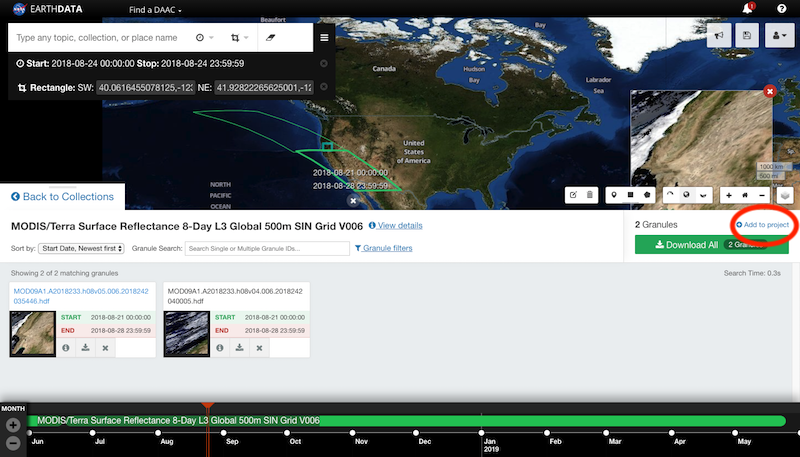
Earthdata Search is NASA's EOSDIS tool for searching and discovering data in the EOSDIS collection as well as U.S and international agencies across the Earth science disciplines.
Users (including those without specific knowledge of the data) can search for and read about data collections, search for data files by date and spatial area, preview browse images, and download or submit requests for data files, with customization for select data collections.
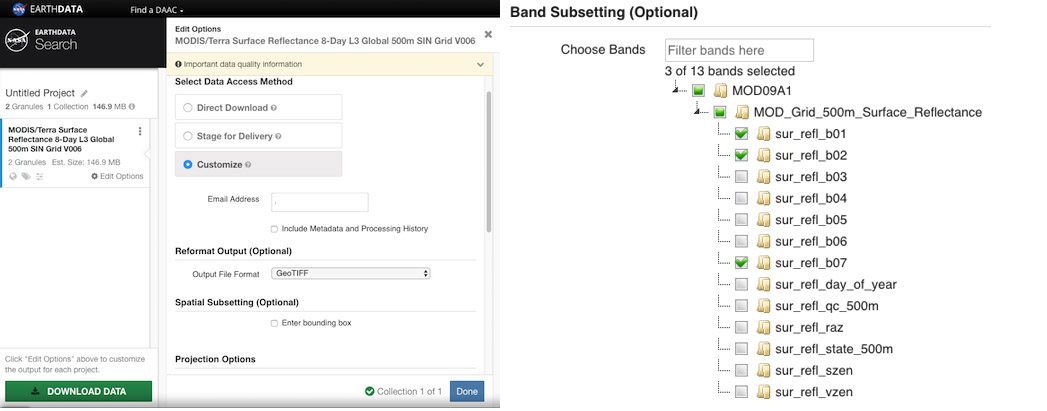
In the project area, for some datasets, users can customize granules. Users can reformat the data and output as HDF, NetCDF, ASCII, KML, or a GeoTIFF and can choose from a variety of projection options. Data can be subset to obtain only the bands that are needed.
HDF and NetCDF files can be viewed in Panoply, a cross-platform application that plots geo-referenced and other arrays. Panoply offers additional functionality, such as slicing and plotting arrays, combining arrays, and exporting plots and animations.
Giovanni is an online environment for the display and analysis of geophysical parameters. There are many options for analysis. The following are the more popular ones:
For more detailed tutorials:
NASA's Worldview visualization application visualization application provides the capability to interactively browse over 1000 global, full-resolution satellite imagery layers and then download the underlying data. Many of the available imagery layers are updated within three hours of observation, essentially showing Earth as it looks "right now." This supports time-critical application areas such as wildfire management, air quality measurements, and flood monitoring. Imagery in Worldview is provided by NASA's Global Imagery Browse Services (GIBS). Worldview also includes nine geostationary imagery layers from GOES-East, GOES-West, and Himawari-8 available at ten minute increments for the last 30 days. These layers include Red Visible, which can be used for analyzing daytime clouds, fog, insolation, and winds; Clean Infrared, which provides cloud top temperature and information about precipitation; and Air Mass RGB, which enables visualization of specific air mass types (e.g., dry air, moist air, etc.). These full disk hemispheric views allow for almost real-time viewing of changes occurring around most of the world.
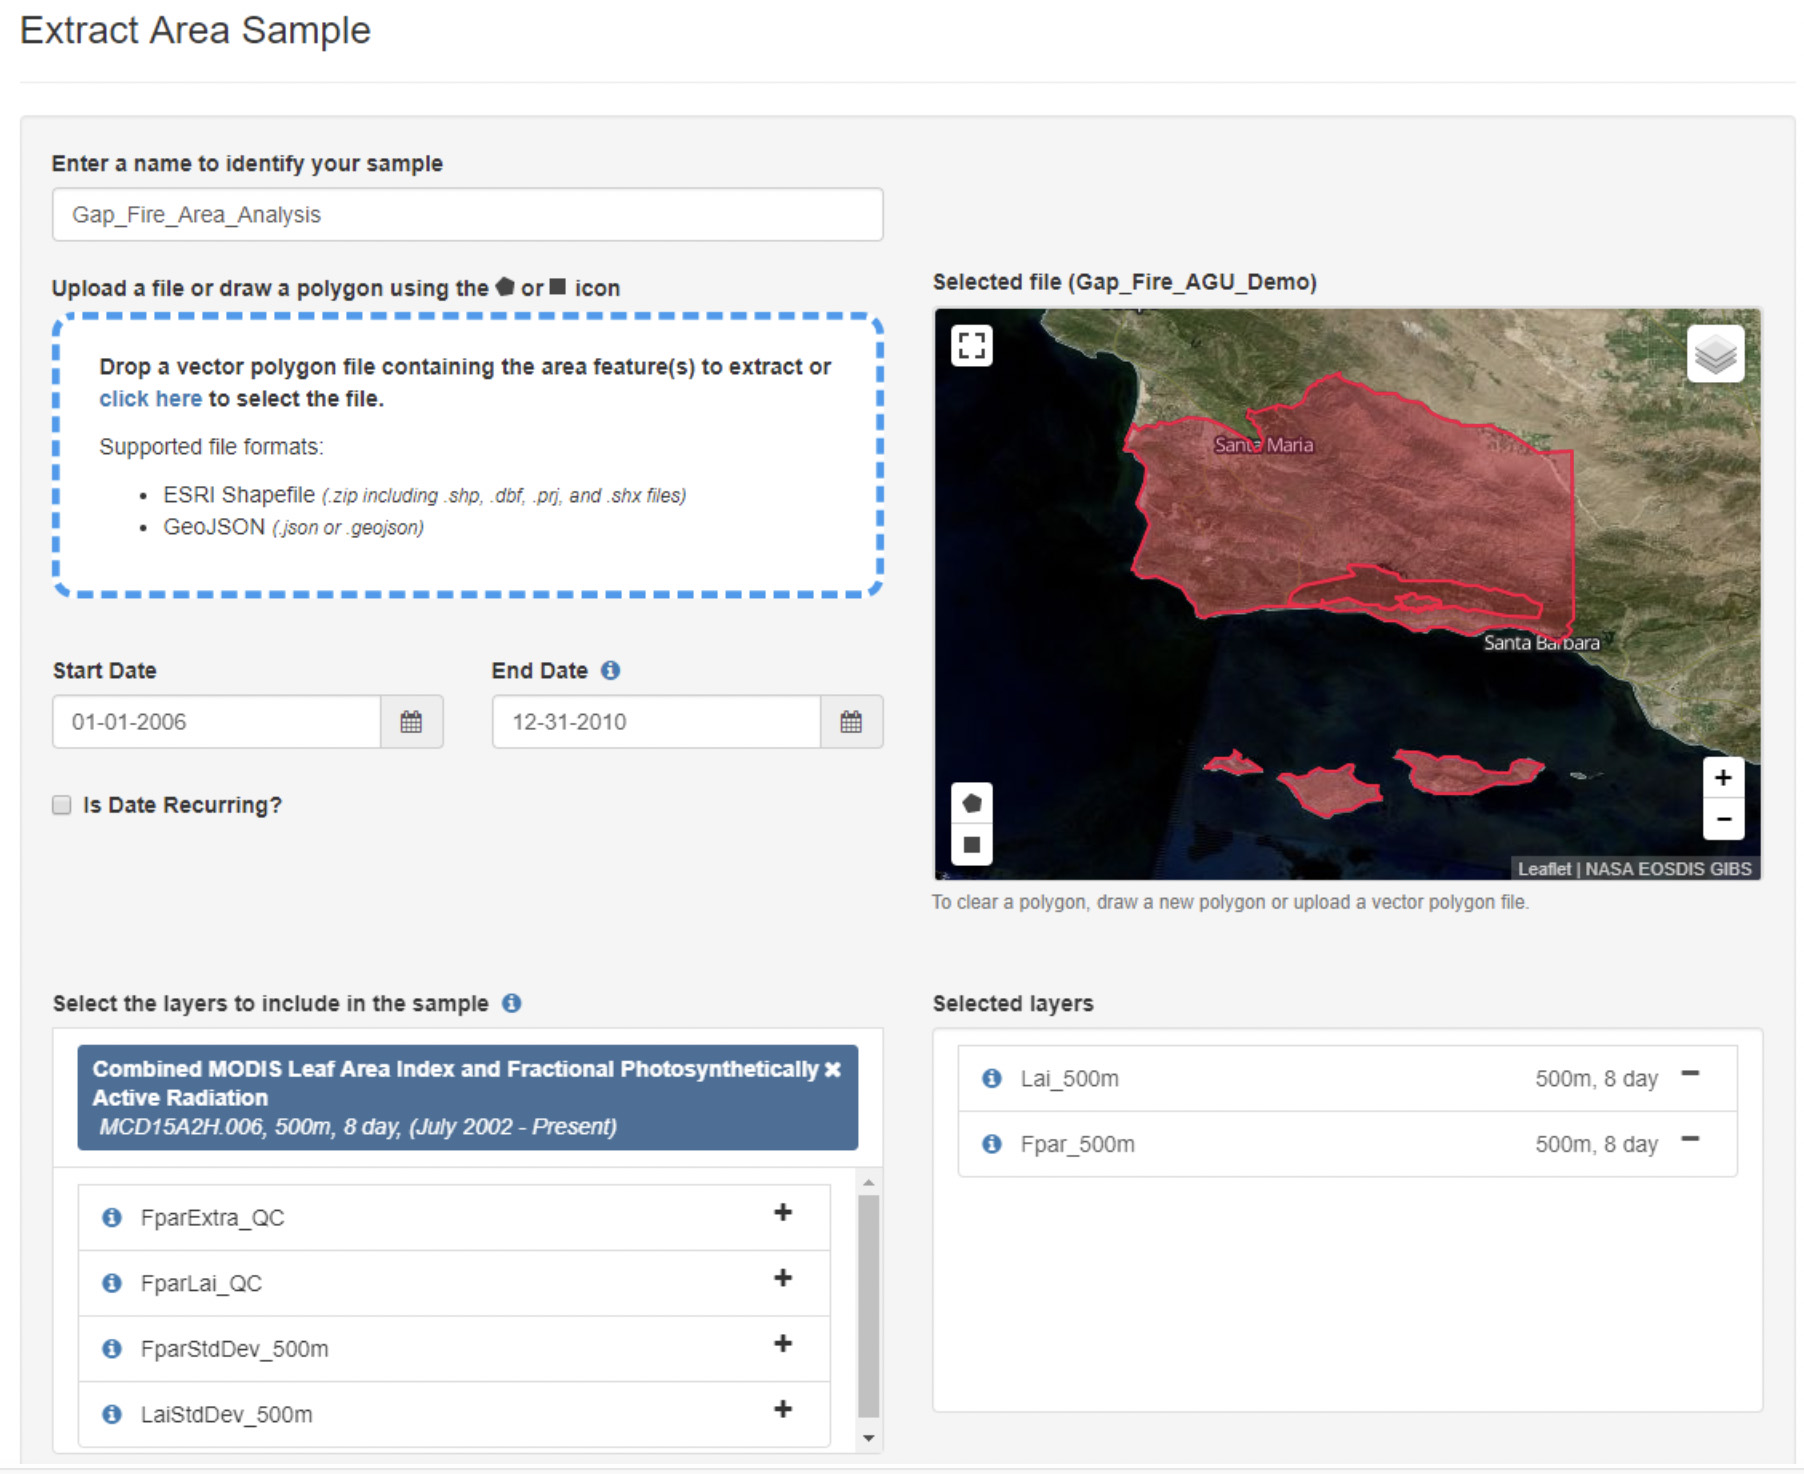
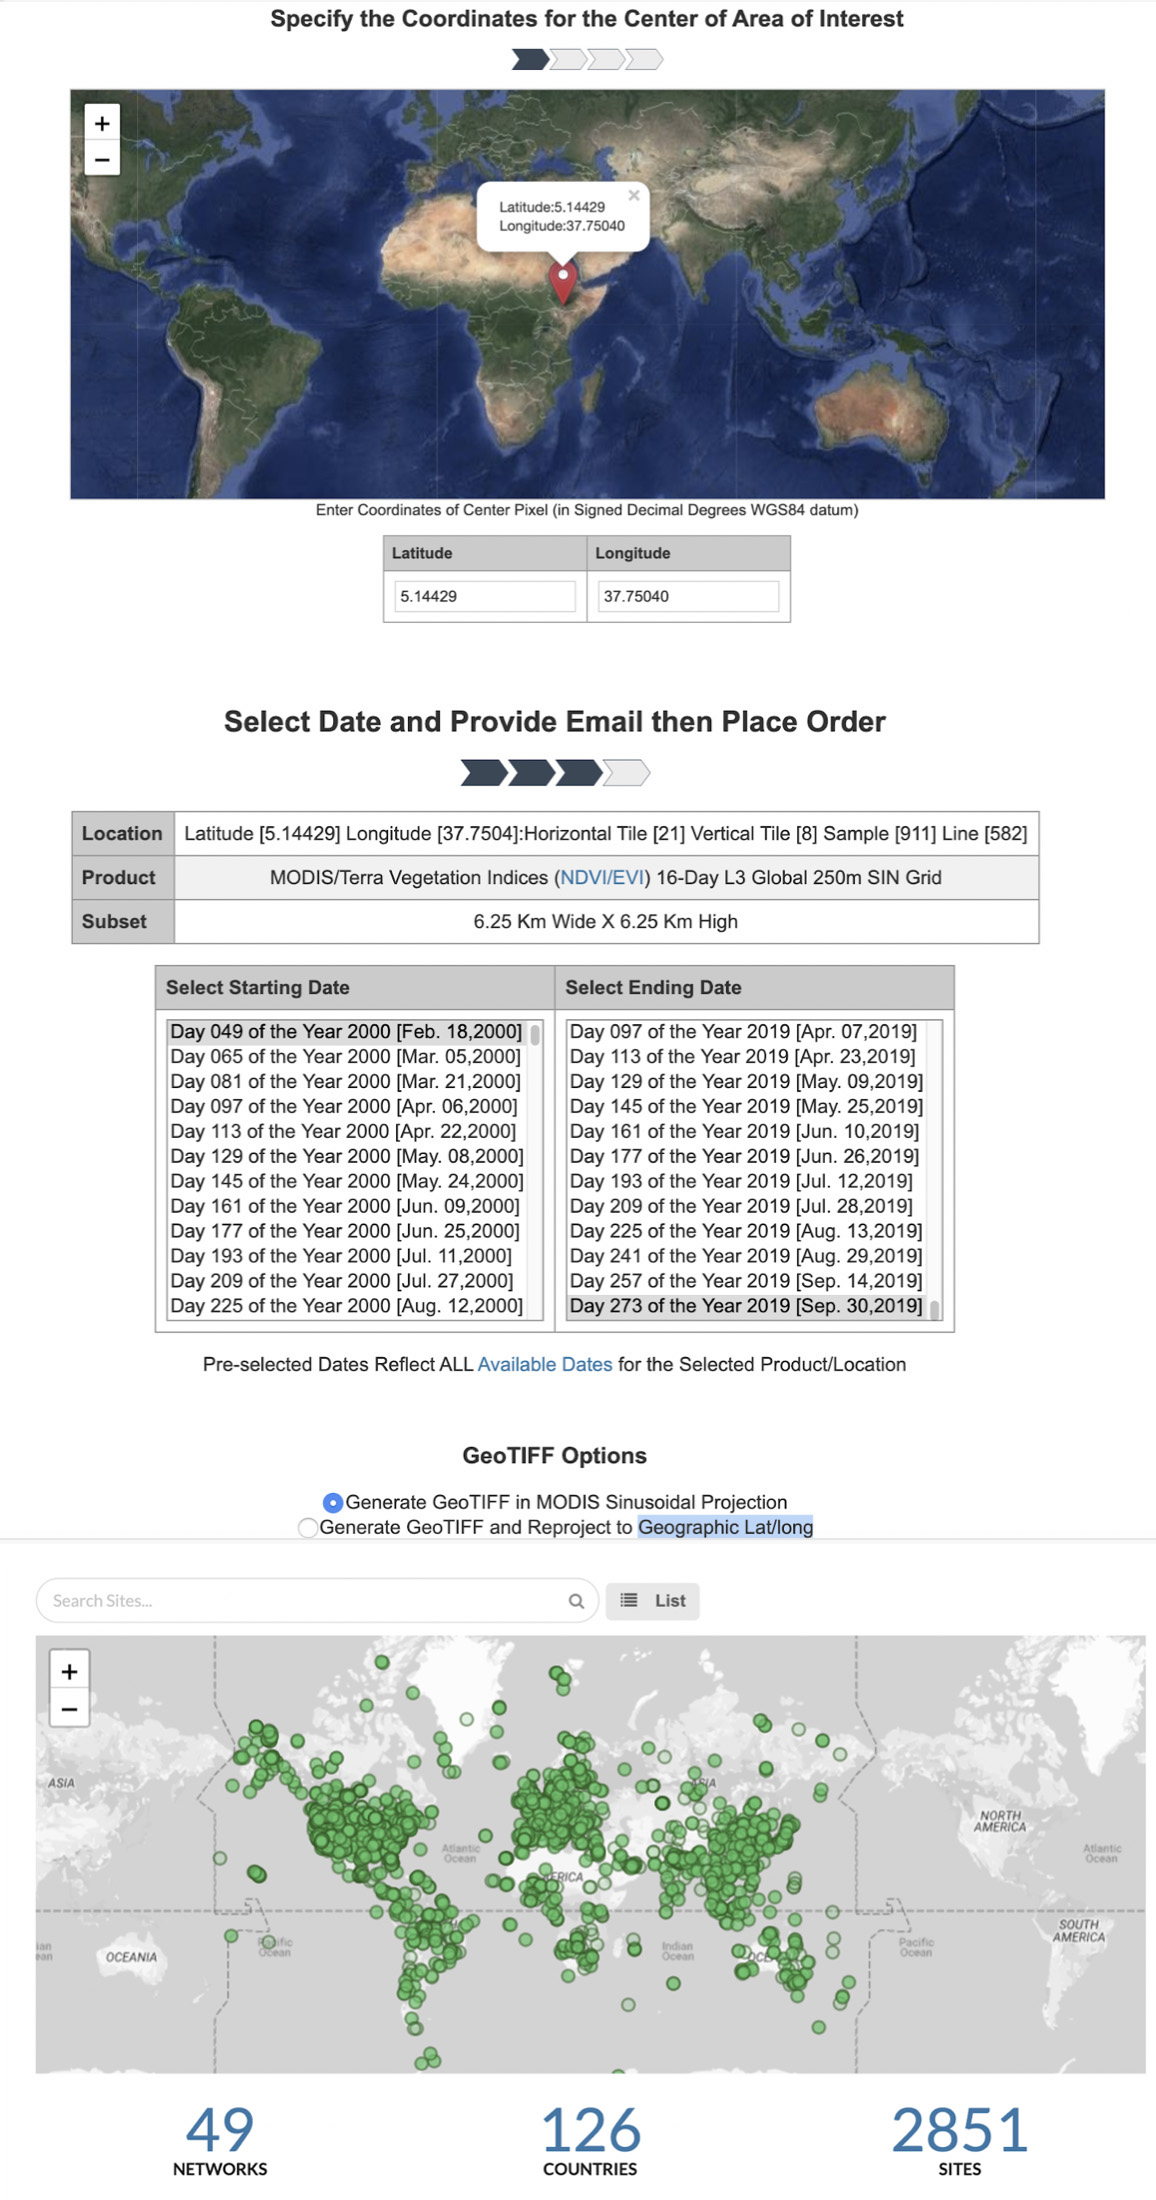
AppEEARS at LP DAAC offers a simple and efficient way to access and transform geospatial data from a variety of federal data archives. AppEEARS enables users to subset geospatial datasets using spatial, temporal, and band/layer parameters. Two types of sample requests are available: point samples for geographic coordinates and area samples for spatial areas via vector polygons.
After requesting an area extraction, users are taken to the Extract Area Sample page where they specify a series of parameters that are used to extract data for the areas of interest.
Define the region of interest in one of three ways:
Select the date range for the time period of interest.
Specify the range of dates for which data are desired for extraction by entering a start and end date (MM-DD-YYYY) or by clicking on the Calendar icon and selecting dates a start and end date in the calendar.
Enter the product short name (e.g., MOD09A1, ECO3ETPTJPL), keywords from the product long name, a spatial resolution, a temporal extent, or a temporal resolution into the search bar. A list of available products matching the query will be generated. Select the layer(s) of interest to add to the Selected layers list. Layers from multiple products can be added to a single request. Be sure to read the list of available products available through AppEEARS.
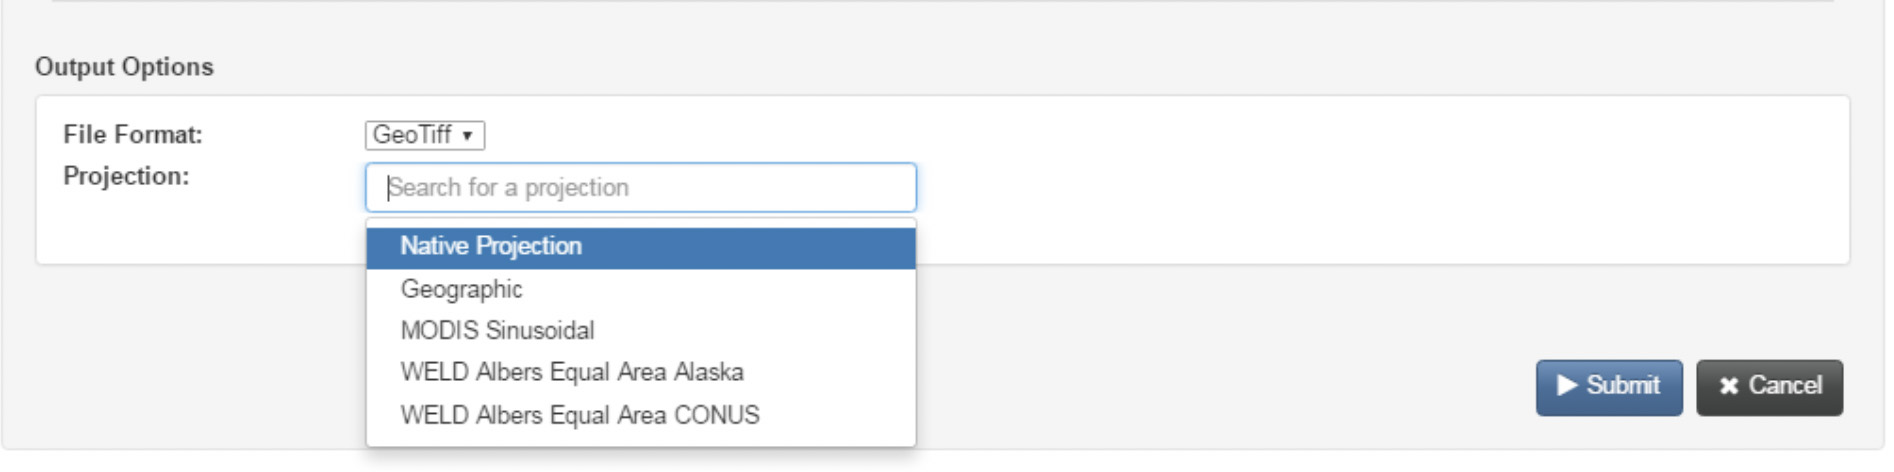
Two output file formats are available:
If GeoTIFF is selected, one GeoTIFF will be created for each feature in the input vector polygon file for each layer by observation. If NetCDF4 is selected, outputs will be grouped into .nc files by product and by feature.
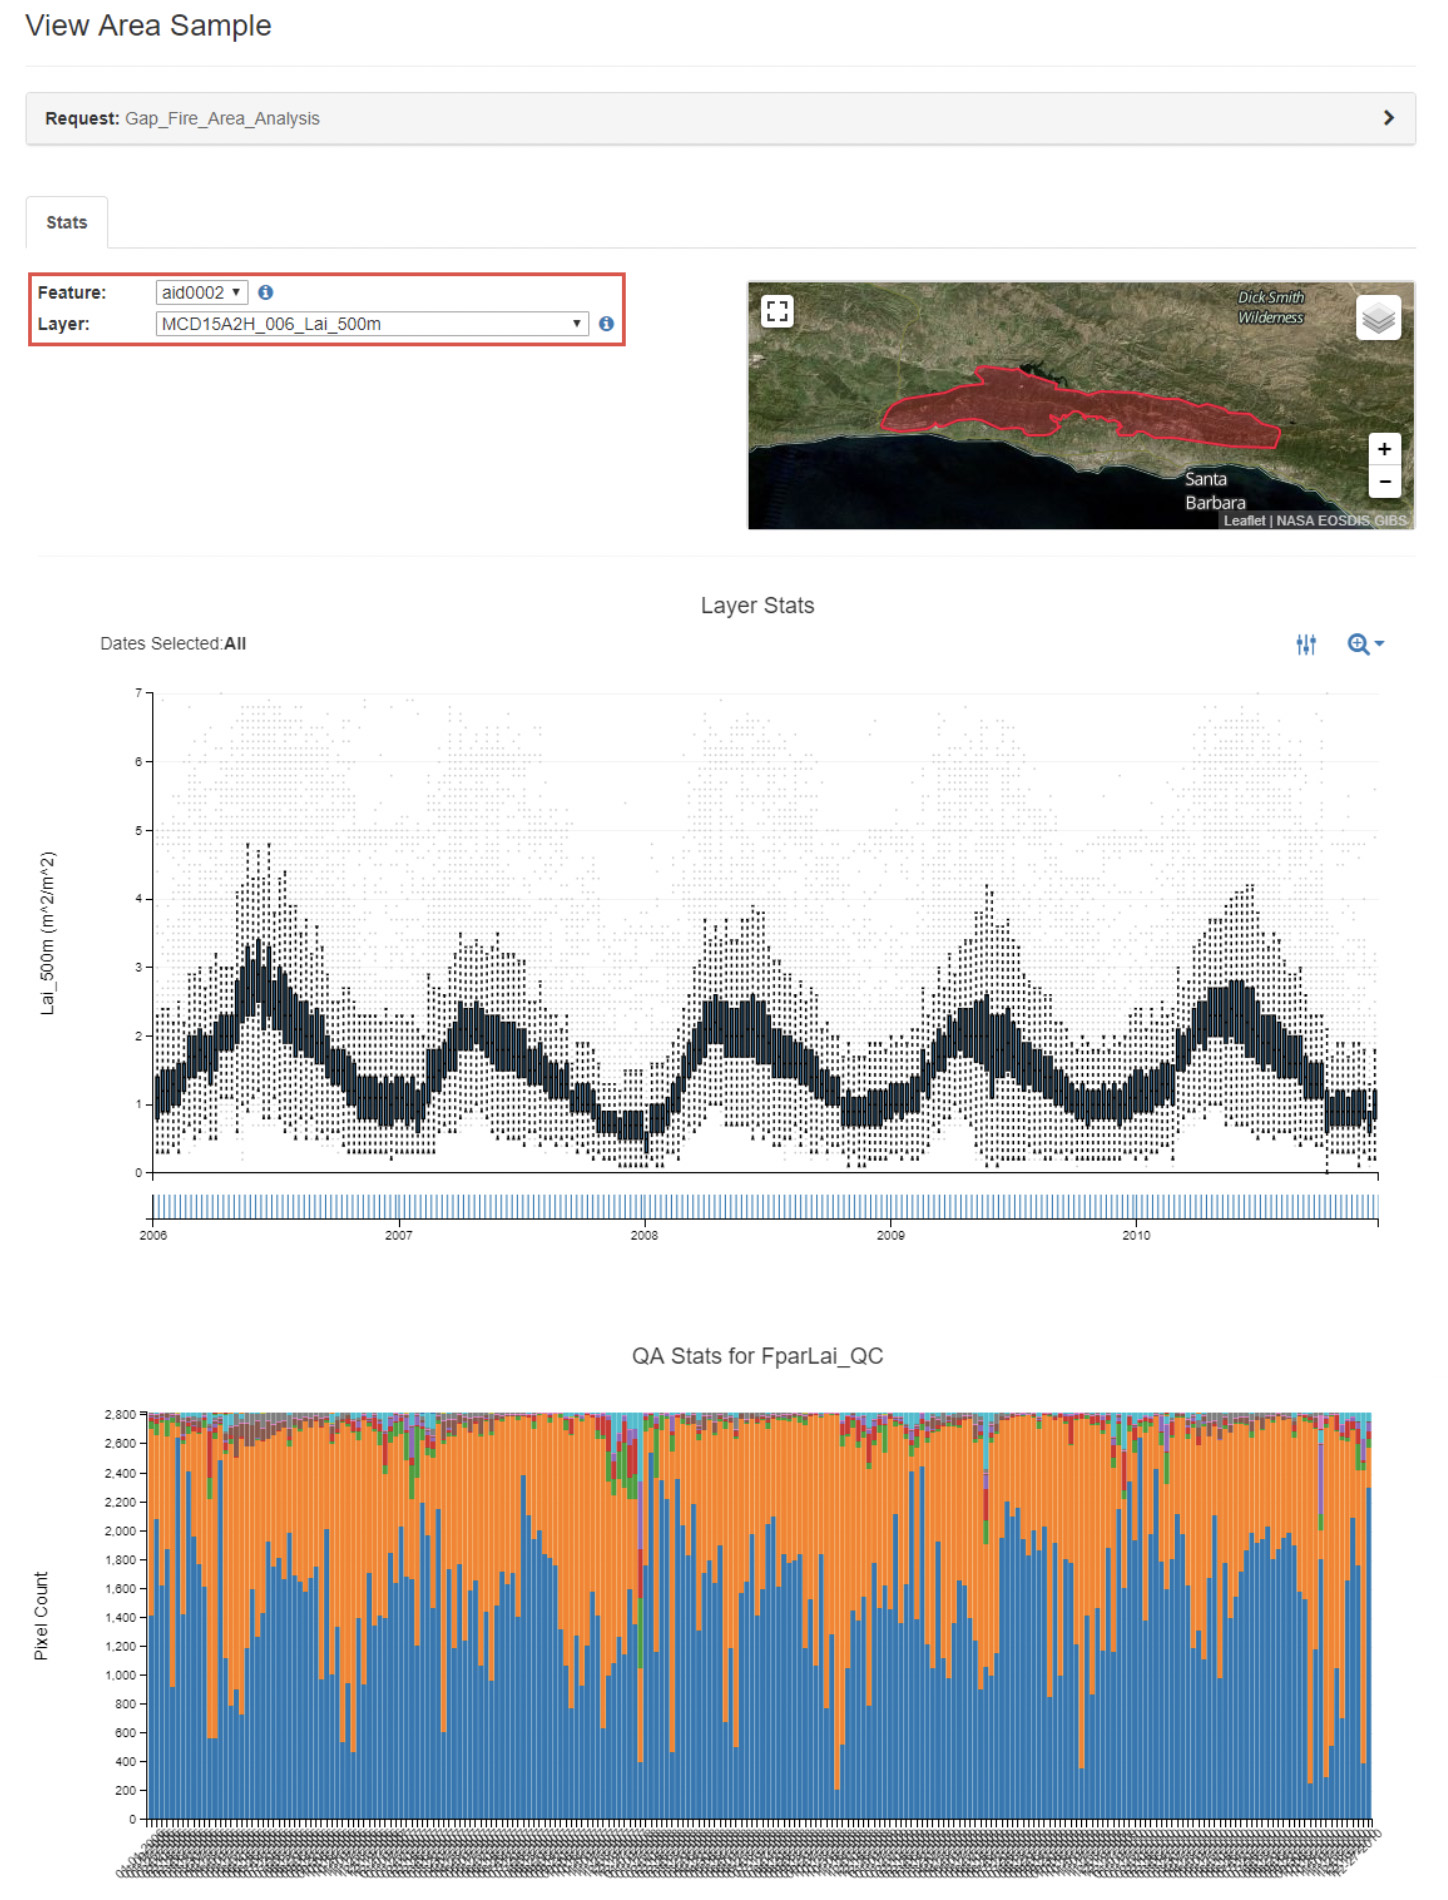
From the Explore Requests page, click the View icon to view and interact with results. This will take users to the View Area Sample page.
The Layer Stats plot provides time series boxplots for all of the sample data for a given feature, data layer, and observation. Each input feature is renamed with a unique AppEEARS ID (AID). If the feature contains attribute table information, users can view the feature attribute table data by clicking on the Information icon to the right of the Feature dropdown. To view statistics from different features or layers, select a different aid from the Feature dropdown and/or a different layer of interest from the Layer dropdown.
Please see the AppEEARS documentation to learn more about downloading the output as GeoTIFF or NetCDF4 files.
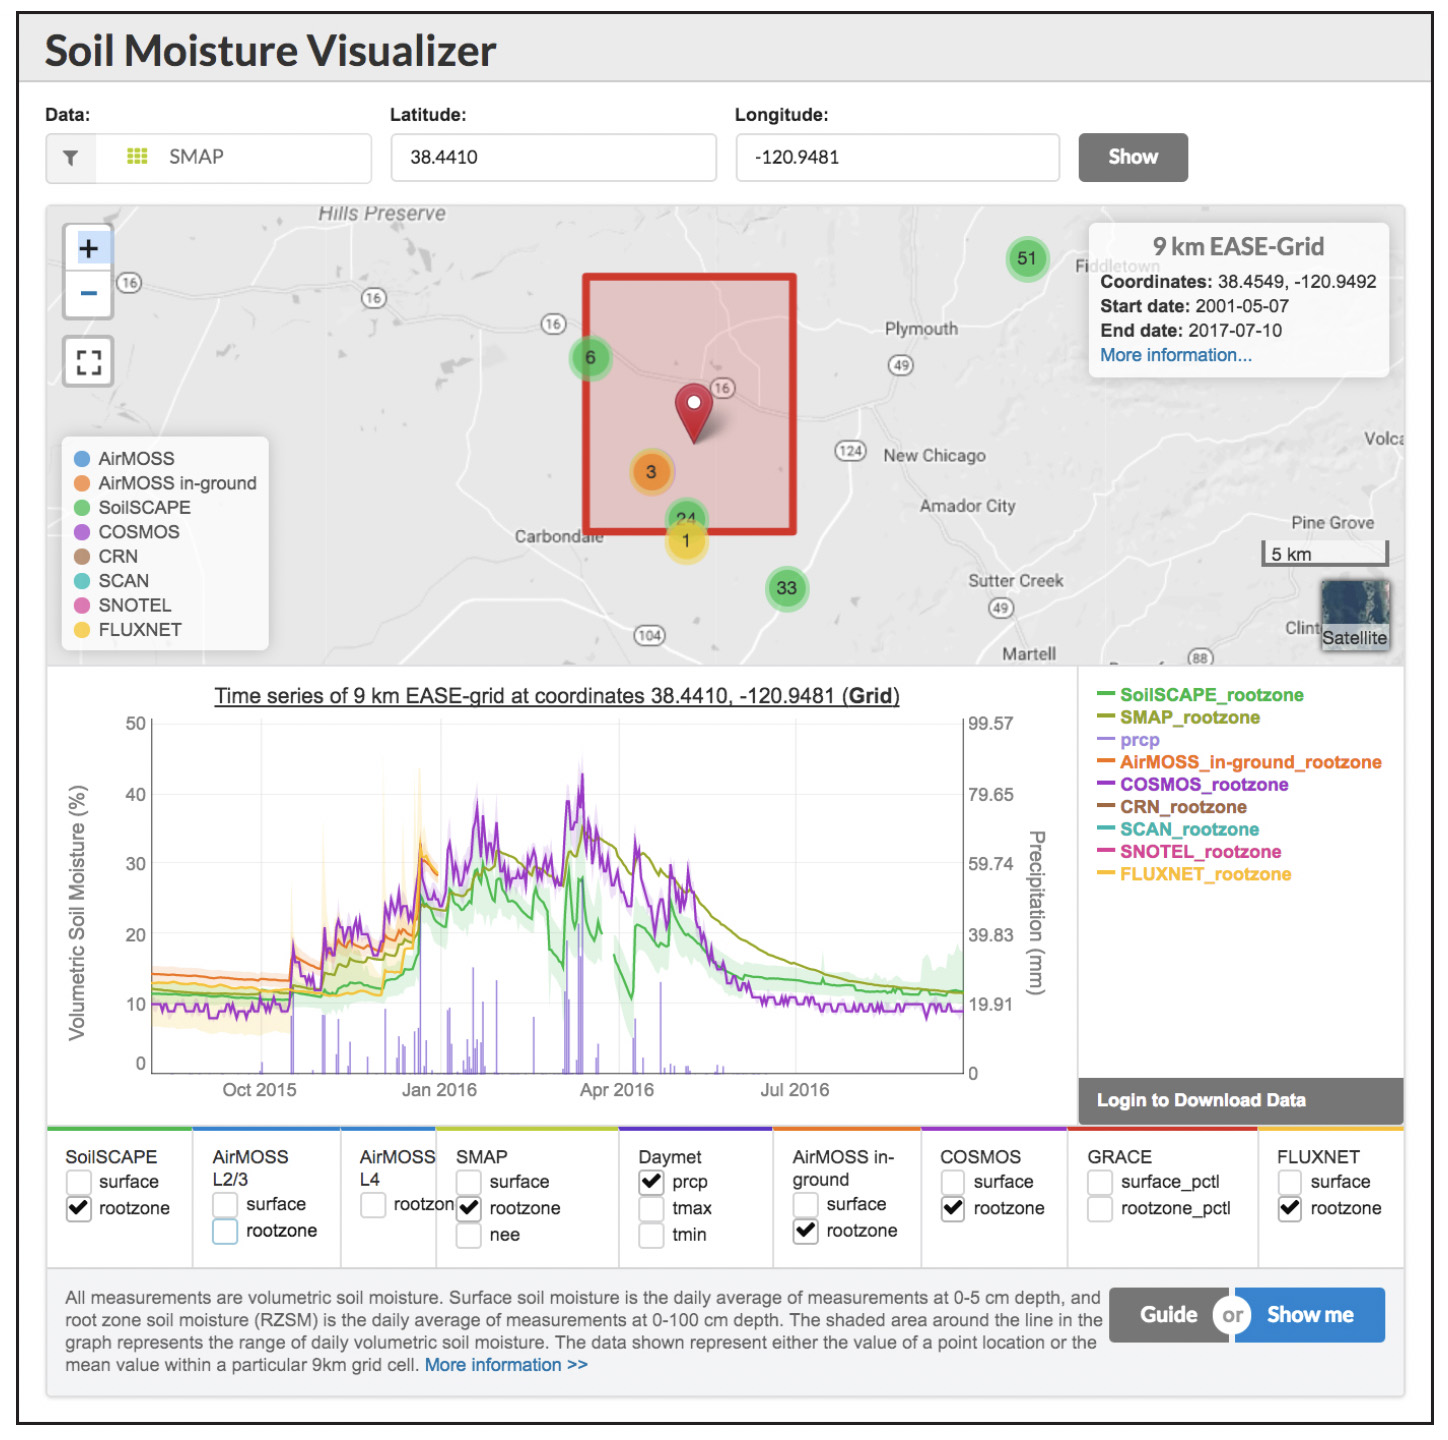
ORNL DAAC developed a Soil Moisture Visualizer tool (read about it at Soil Moisture Data Sets Become Fertile Ground for Applications) that integrates a variety of different soil moisture datasets over North America. The visualization tool incorporates in-situ, airborne, and remote sensing data into one easy-to-use platform. This integration helps to validate and calibrate the data and provides spatial and temporal data continuity. It also facilitates exploratory analysis and data discovery for different groups of users. The Soil Moisture Visualizer offers the capability to geographically subset and download time series data in .csv format. For more information on the available datasets and use of the visualizer, view the Soil Moisture Visualizer Guide.
To use the visualizer, select a dataset of interest under Data. Depending on the dataset chosen, the visualizer provides the included latitude/longitude or an actual site location name and relative time frames of data collection. Upon selecting a parameter, the tool displays a time series with available datasets. All measurements are volumetric soil moisture. Surface soil moisture is the daily average of measurements at 0-5 cm depth and root zone soil moisture (RZSM) is the daily average of measurements at 0-100 cm depth. The visualizer also provides data sources for download.
NASA's OpenAltimetry (OA) is a free and powerful map-based data visualization and discovery tool for exploring surface elevation profiles from ICESat and ICESat-2 satellite mission altimetry data. Use OA explore how different types of surface heights have changed across the Earth over time. You can also easily download the data without the need for any special software or scripts; all you need is a web browser.
OA's ICESat-2 elevation data include observations from 2018 to present. The data show multiple photon beams, one day at a time, and users can easily select different dates and overlay MODIS cloud cover data. Types of altimetry data include:
ICESat elevation data: This data set is GLAH06 Global Elevation Data. ICESat is the predecessor to ICESat-2 and collected data from 2003 through early 2010.
ORNL DAAC also has several tools for subsetting data from the MODIS and VIIRS instruments:
NASA’s Applied Sciences Biological Diversity and Ecological Forecasting Program supports basic research that advances the understanding of how and why biological diversity is changing. NASA's Applied Remote Sensing Training Program (ARSET) also provides a number of webinars on land management and conservation. Webinars are conducted in a several different languages.
NASA’s Terrestrial Ecology Program researches Earth's carbon cycle and ecosystems using space-based observations. The focus is on land-based ecosystems, changes in their structure and functioning, and their roles in supporting human life and maintaining Earth's habitability.
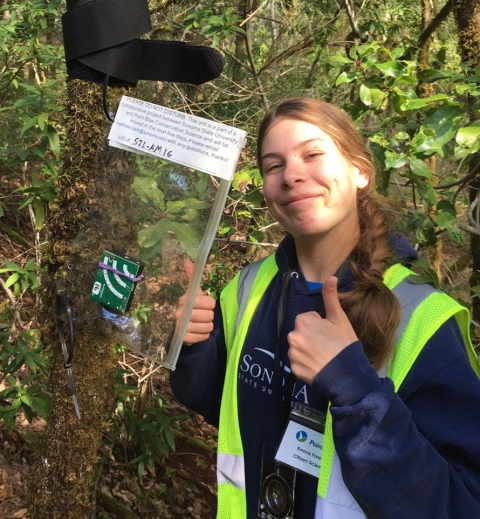
Soundscapes to Landscapes is a project of NASA's Earth Science Data Systems (ESDS) Citizen Science for Earth Systems Program (CSESP), which combines bioacoustic data collected by citizen scientists with satellite and environmental data to monitor bird diversity in Sonoma County, California.
Floating Forests is another CSESP project that trains citizen scientists to trace patches of kelp on Landsat imagery. So far, more than 20 years of imagery has been processed. The results are helping to uncover the history of giant kelp forests around the globe and the environmental factors that affect them.
COral Reef Airborne Laboratory (CORAL) is a mission to determine the relationship between coral reef condition and biogeophysical forcing parameters.
The Oceanographic In-situ data Interoperability Project (OIIP) is a collaboration among JPL, UCAR/Unidata, and the Large Pelagics Research Center (LPRC) at the University of Massachusetts, Boston. The goal of the project is to address interoperability and data challenges associated with the integration of oceanographic in-situ datasets and satellite Earth observations using field campaign measurements and marine animal electronic tagging data as test cases.
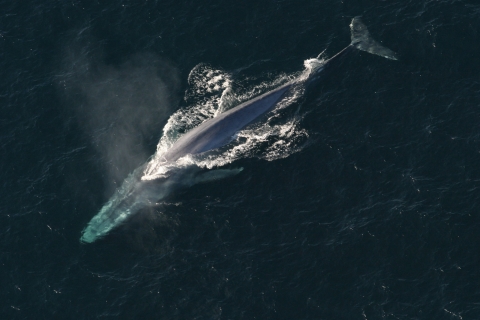
WhaleWatch is a NASA-funded project coordinated by NOAA Fisheries' West Coast Region to help reduce human impacts on whales by providing near real-time information on where whales have been observed and where they might be most at risk from threats such as ship strikes, entanglements, and loud underwater sounds.
Landfire, or the Landscape Fire and Resource Management Planning Tools, is a shared program between the wildland fire management programs of the U.S. Forest Service and U.S. Department of the Interior, providing landscape-scale geospatial products that describe vegetation, wildland fuel, and fire regimes across the United States and its territories.
Global Forest Watch provides data and tools for monitoring forests, specifically tree loss and gain, and biodiversity hotspots.
The United Nations Biodiversity Lab is an online platform that allows policymakers and other partners to access global data layers, upload and manipulate their own datasets, and query multiple datasets to provide key information on the Aichi Biodiversity Targets and nature-based Sustainable Development Goals. The core mission of the U.N. Biodiversity Lab is three-fold: to build spatial literacy to enable better decisions, to use spatial data as a vehicle for improved transparency and accountability, and to apply insights from spatial data across sectors to deliver on the Convention on Biological Diversity and the 2030 Agenda for Sustainable Development. The Applied Remote Sensing Training Program (ARSET) also has an introductory webinar, Using the U.N. Biodiversity Lab to Support National Conservation and Sustainable Development Goals, for additional information on using the U.N. Biodiversity Lab.
Trends.Earth provides maps that monitor land degradation as it applies to Sustainable Development Goal (SDG) 15.3.1. SDG target 15.3 states: “By 2030, combat desertification, restore degraded land and soil, including land affected by desertification, drought and floods, and strive to achieve a land degradation-neutral world.”
The Tagging of Pelagic Predators (TOPP) program is an international collaboration that allows users to interact with tracking data and oceanographic datasets to observe marine megafauna, understand factors influencing animal behavior in the ocean, and use sensor data from animal tags to aid in climate models and a better understanding of ocean ecosystems.
Pelagic Habitat Analysis Module (PHAM) is a GIS software tool for fisheries managers, scientists, and researchers to examine and predict pelagic ocean biota habitat; it uses biota presence/absence or abundance data combined with environmental data (satellite imagery, bathymetry, survey cruises, and ocean circulation models).
NOAA TurtleWatch is a map providing up-to-date information about the thermal habitat of loggerhead sea turtles in the Pacific Ocean north of the Hawaiian Islands.
Benefits and Limitations of Remote Sensing Data
When deciding to use remote sensing data, it is important to consider both the benefits and the limitations of the data.
Benefits of using satellite data include:
Limitations specific to using satellite data in ecological assessments:
A limitation with ground-based data:
It is not possible to combine all desirable features into one remote sensor; to acquire observations with high spatial resolution (like Landsat) a narrower swath is required, which in turn requires more time between observations of a given area, resulting in a lower temporal resolution. Researchers have to make trade-offs. Finding a sensor with the spatio-temporal resolution capable of addressing your research, application, or decision making process needs is a crucial first step to getting started with using remote sensing data.